Big Games Bring Big Numbers
Below are the top performing venues from the past week as well as a few interesting trends we noticed.
Top Teams Total Big Numbers
- The top five pro and college venues in our data usage rankings hosted some of the week’s biggest games and best teams.
- Out of the 10 teams that played in the top five venues for data usage, only two were not ranked entering the game. The other eight teams accounted for 40% of the top 20 teams in the rankings entering the game.
- In pro football, the top five venues hosted the best of the best as well.
- Four out of the five games hosted a team that entered the contest in either first place or tied for first place in their respective division.
- The teams playing in these venues entered the games with a combined record of 29-19.
- Unlike most weeks this season, there was no trend this past week indicating more data was used during close games than blowout games.
- Between the top five games in college and pro football the average score differential was more than 10 points.
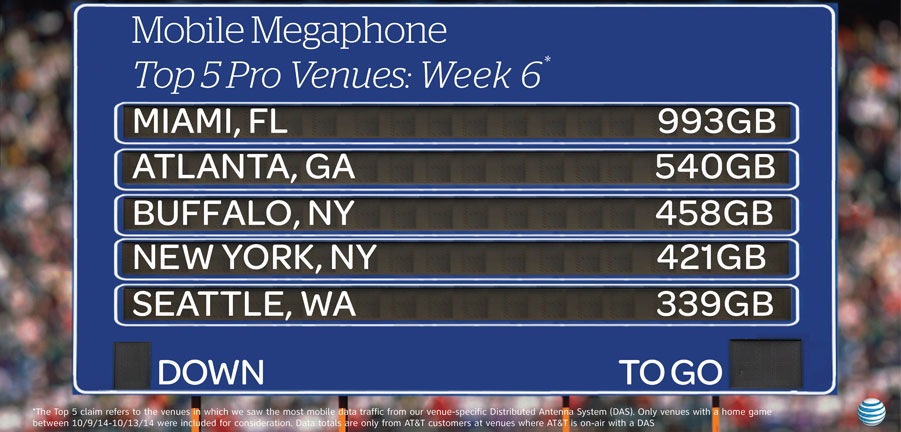
Top 5 Professional Venues by Total Mobile Data (10/9-10/13)
- Miami, FL – 993GB
- Equivalent to more than 2.8 million social media post with photos
- Atlanta, GA – 540GB
- Equivalent to more than 1.5 million social media post with photos
- Buffalo, NY – 458GB
- Equivalent to more than 1.3 million social media post with photos
- New York, NY – 421GB
- Equivalent to more than 1.2 million social media post with photos
- Seattle, WA – 339GB
- Equivalent to more than 965K social media post with photos

Top 5 Collegiate Venues by Total Mobile Data (10/9-10/11)
- Waco, TX – 774GB
- Equivalent to more than 2.2 million social media post with photos
- Fayetteville, AR – 681GB
- Equivalent to more than 1.9 million social media post with photos
- Pasadena, CA – 495GB
- Equivalent to more than 1.4 million social media post with photos
- Starkville, MS – 464GB
- Equivalent to more than 1.3 million social media post with photos
- South Bend, IN – 447GB
- Equivalent to more than 1.2 million social media post with photos
Caveats:
- All figures include only data traffic seen on AT&T’s venue-specific mobile network.
- All data metrics come from only venues with a DAS where AT&T’s mobile network is on-air. These metrics are not comprehensive of every game played during this past weekend for professional or college football.
- This data is compiled from only football stadiums that had home games during this selected timeframe where AT&T is on-air on a DAS.