On Monday, August 21, people across the U.S. witnessed a rare phenomenon – a total solar eclipse. At AT&T Labs, we’re always monitoring network traffic, and this year’s eclipse gave us an opportunity to look at our network data in a way we never have before.

Nanocubes Visual: View of southeastern U.S. shows a 2.5x spike in SMS activity during the 24-hour period of eclipse path of totality versus previous Monday. In all heatmaps, pixels are colored according to which time period had a larger number of records: orange for the previous Monday and blue for the Monday of the eclipse. Darker regions indicate larger numbers of records.
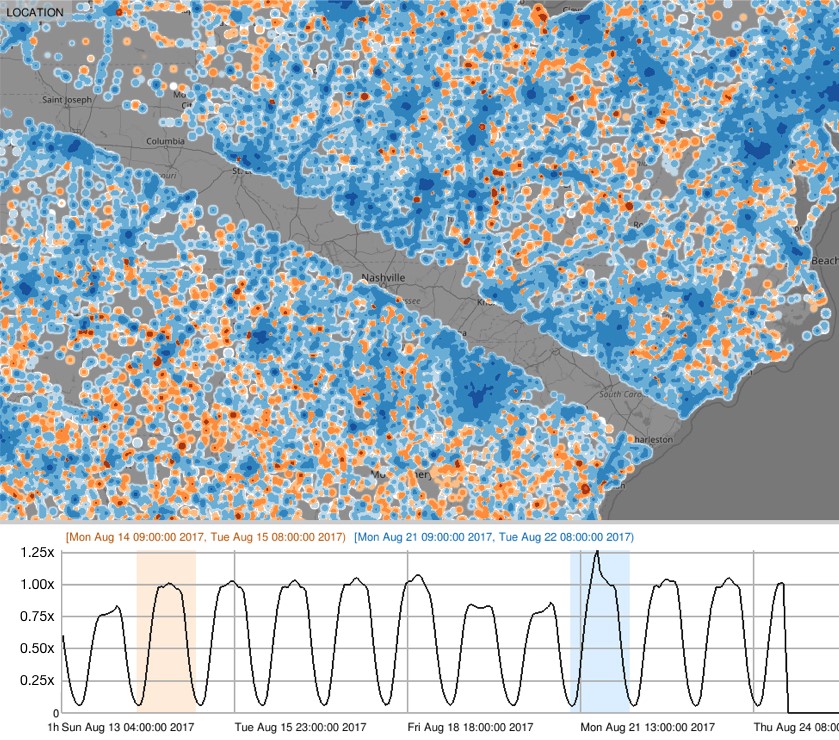
Nanocubes Visual: Close-up view of southeastern U.S., specifically regions outside of the eclipse path that show more SMS activity during the 24-hour period of eclipse path of totality (blue) versus the previous Monday (orange).
The images displayed are from our data visualization tool, Nanocubes. We developed Nanocubes at AT&T Labs to understand the massively large data points we analyze every day. And the software is available as open source for anyone to build upon and apply to other diverse datasets.
We took a closer look at the number of text messages and phone calls that crossed our network during the time of the eclipse. It helped us draw key insights that show us how our customers are sharing historical moments with friends and family.
The network data patterns we saw across the path of totality didn’t disappoint:
- Total voice records increased by 15% for 24 hours surrounding the eclipse.
- Total data records increased by 25% for 24 hours surrounding the eclipse.
- Total SMS records increased by 40% for 24 hours surrounding the eclipse.
Even more, we saw significant increases in network usage in regions along the path of totality:
- Spikes in network traffic as much as 6x in small towns, like Madras, Oregon.
- Up to 2x in large cities, like St. Louis, Nashville, Tennessee and Lincoln, Nebraska.
- And in some cases, as much as 15x spikes around certain cell towers.
When analyzing network usage in the days leading up to the eclipse, the data shows peak travel time to have been the Saturday before the eclipse.
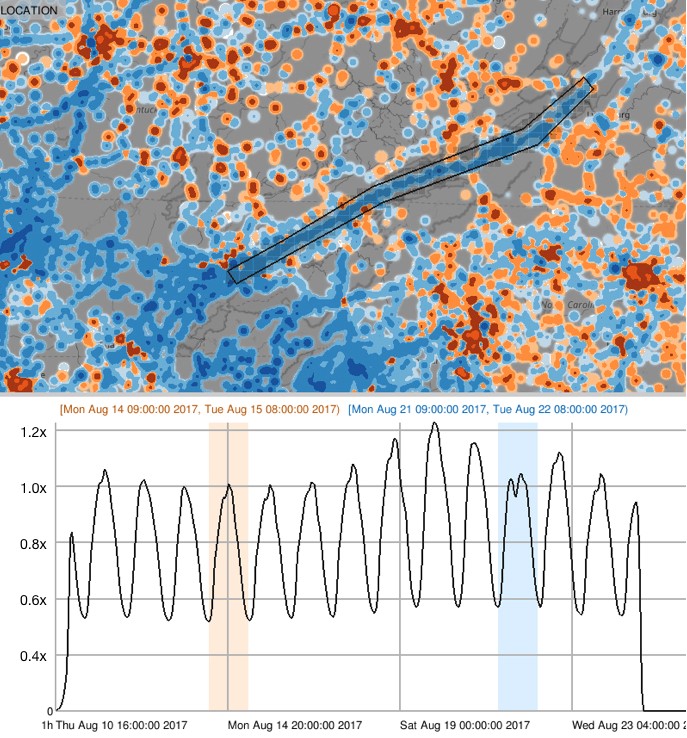
Nanocubes Visual: View of the spatial selection of Interstate 81 in southeastern U.S. The time series shows network traffic data increasing along the highway from Thursday to Friday and maxing out on Saturday. Sunday and Monday are less as people have already arrived within the path of totality.
We did come across some surprises. In Portland, Oregon, we noticed a decrease in network traffic data on the day of the eclipse. Why? Our hypothesis is people drove south toward Bend, Oregon to be inside the path of totality.
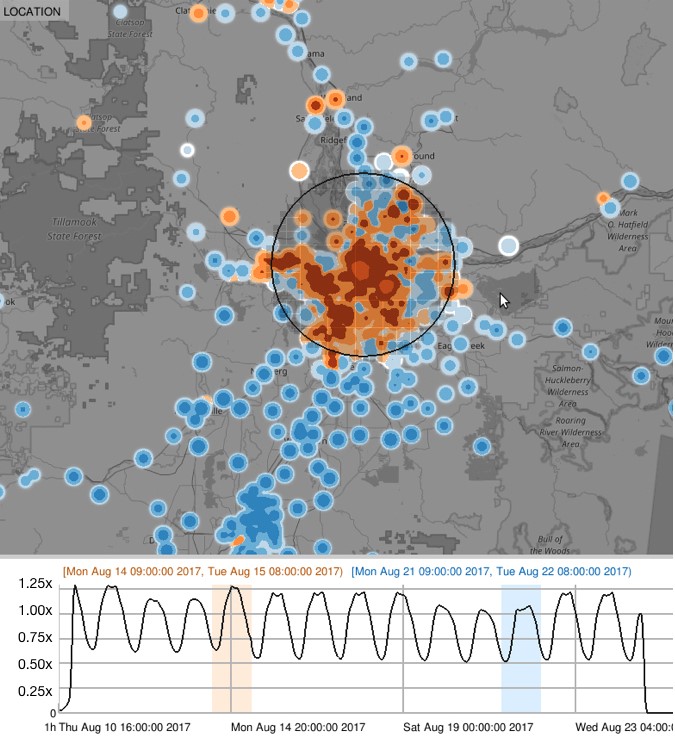
Nanocubes Visual: View of Portland showing the decrease in network activity during the eclipse (blue) versus the previous Monday (orange).
We look forward to using Nanocubes during the next eclipse in 2024 to see how customers share their experience – whether it’s via text message or AR and VR devices of the future. For more information on Nanocubes technology, check out nanocubes.net.