Data Traffic Up During Divisional Playoff Round
Fans were root, root, rooting for their home team during the Divisional Round of the professional baseball playoffs at ballparks across the country. And in doing so, they are sharing their favorite memories – from the seventh inning stretch to the big home run – via their mobile devices with family and friends.
Out of the ballparks where we had a venue-specific cellular Distributed Antenna System (DAS) network on-air, we saw some interesting traffic metrics across our network in the latest round of the October action:
- The greatest increase in mobile data usage was in Anaheim, where was saw a 140% increase in traffic when comparing the average data usage per game during the divisional round of the playoffs compared to the average data usage per game during the regular season home finale.
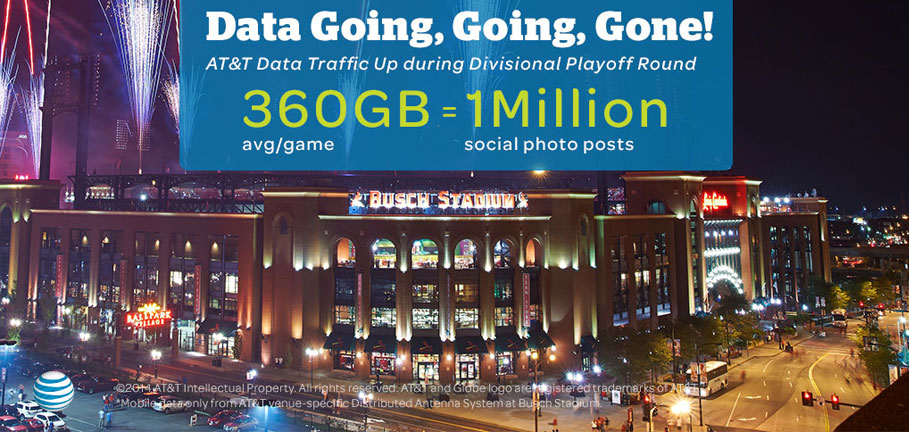
- The highest average mobile data usage per game was in St. Louis with more than 360GB of data averaged per game. This is equivalent to more than 1,025,000 social media posts with photos.
- The highest single game total for mobile data usage was in Los Angeles with more than 376GB of data in a single game. This is equivalent to more than 1,075,000 social media posts with photos.
- The highest peak hour of mobile data usage in a single game was in San Francisco with more than 73GB of data crossing the network in a single hour from 6-7pm PT on 10/7. This is equivalent to more than 205K social media posts with photos.