More Football, More Metrics

We are officially past the midway mark of the pro and college football season and the data from our in-venue mobile networks continues to pour in. Let’s take a look at the most data-heavy venues from the past week as well as a few interesting trends we noticed.
Southern Appeal
- If we were using a data-driven heat map to track mobile usage at this past week’s games it would correlate well with an actual temperature map of the U.S. Venues located in the South dominated data usage this past week. Following the U.S. Census regional breakdown map, we saw:
- In pro football, the two top data-heavy games were played in the South region. The regional average breakdown per game had a heavy southern lean.
- Midwest – 209GB; Northeast – 320GB; West – 404GB; South – 552GB
- In college football, 4 out of the top five data-heavy games were played in the South region. Again, the regional breakdown favored the South.
- Northeast – 83GB; Midwest – 222GB; West – 269GB; South – 395GB
- In pro football, the two top data-heavy games were played in the South region. The regional average breakdown per game had a heavy southern lean.
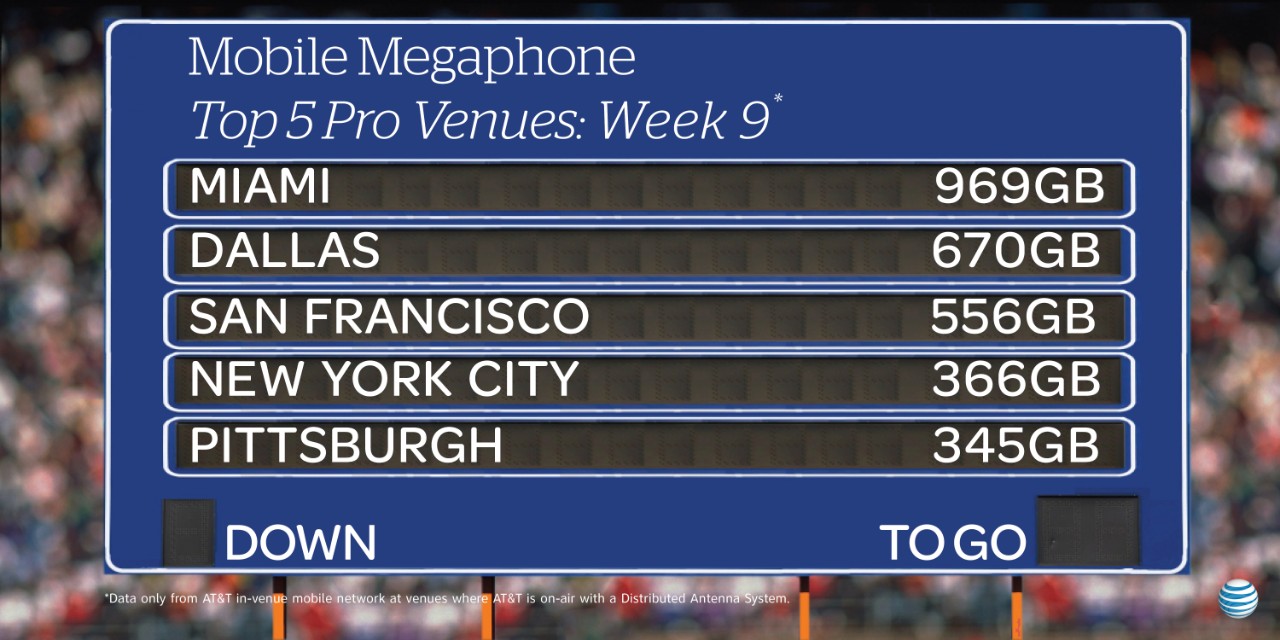
Top 5 Professional Venues by Total Mobile Data (10/30-11/3)
- Miami – 969GB
- Equivalent to more than 2.7 million social media post with photos
- Dallas – 670GB
- Equivalent to more than 1.9 million social media post with photos
- San Francisco – 556GB
- Equivalent to more than 1.5 million social media post with photos
- New York City – 366GB
- Equivalent to more than 1 million social media post with photos
- Pittsburgh – 345GB
- Equivalent to more than 986K social media post with photos

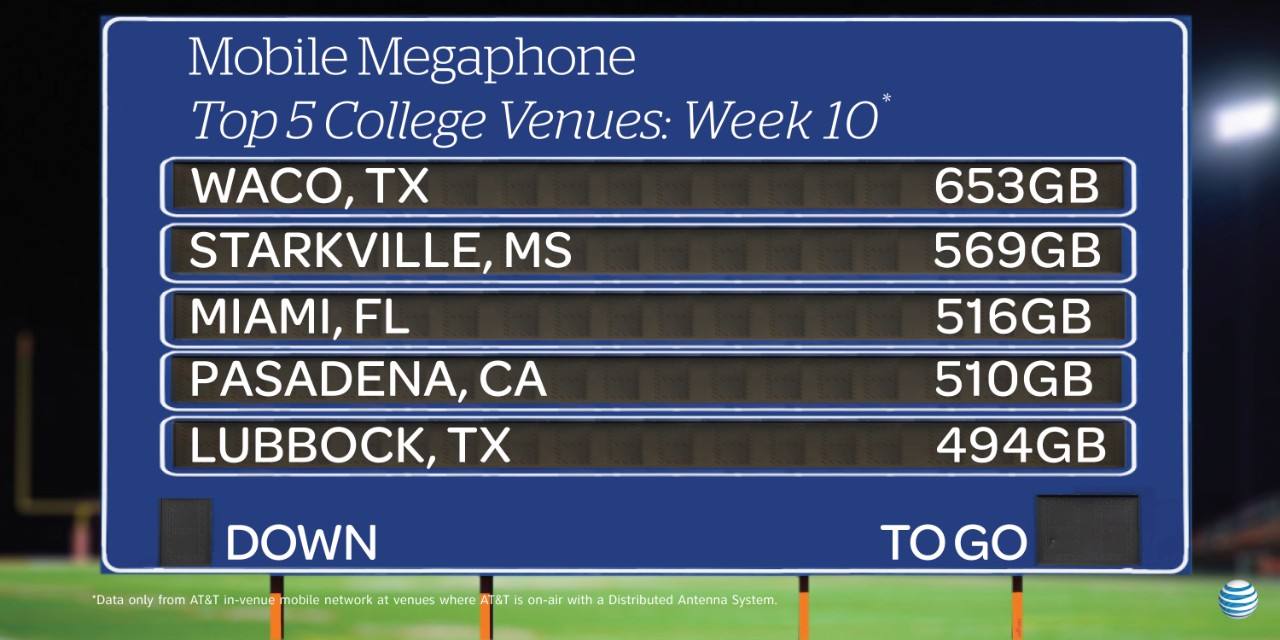
Top 5 Collegiate Venues by Total Mobile Data (10/30-11/1)
- Waco, TX – 653GB
- Equivalent to more than 1.8 million social media post with photos
- Starkville, MS – 569GB
- Equivalent to more than 1.6 million social media post with photos
- Miami, FL – 516GB
- Equivalent to more than 1.4 million social media post with photos
- Pasadena, CA – 510GB
- Equivalent to more than 1.4 million social media post with photos
- Lubbock, TX – 494GB
- Equivalent to more than 1.4 million social media post with photos

Caveats:
- All figures include only data traffic seen on AT&T’s venue-specific mobile network.
- All data metrics come from only venues with a DAS where AT&T’s mobile network is on-air and under contract. These metrics are not comprehensive of every game played during this past weekend for professional or college football.
- This data is compiled from only football stadiums that had home games during this selected timeframe where AT&T is on-air on a DAS.


