Network Scores!
Another week of football is nearly upon us. To help you get excited for the next round of games from the gridiron, let’s take a quick look back on some of the interesting metrics we saw on our mobile networks at stadiums across the country last week. Below are the top performing venues from the past week as well as a few interesting trends we noticed.
Top 5 Professional Venues by Total Mobile Data (11/6-11/10)
- New Orleans – 642GB
- Equivalent to more than 1.8 million social media post with photos
- New York City – 403GB
- Equivalent to more than 1.1 million social media post with photos
- Buffalo – 366GB
- Equivalent to more than 1 million social media post with photos
- Oakland – 299GB
- Equivalent to more than 855K social media post with photos
- Seattle – 286GB
- Equivalent to more than 817K social media post with photos

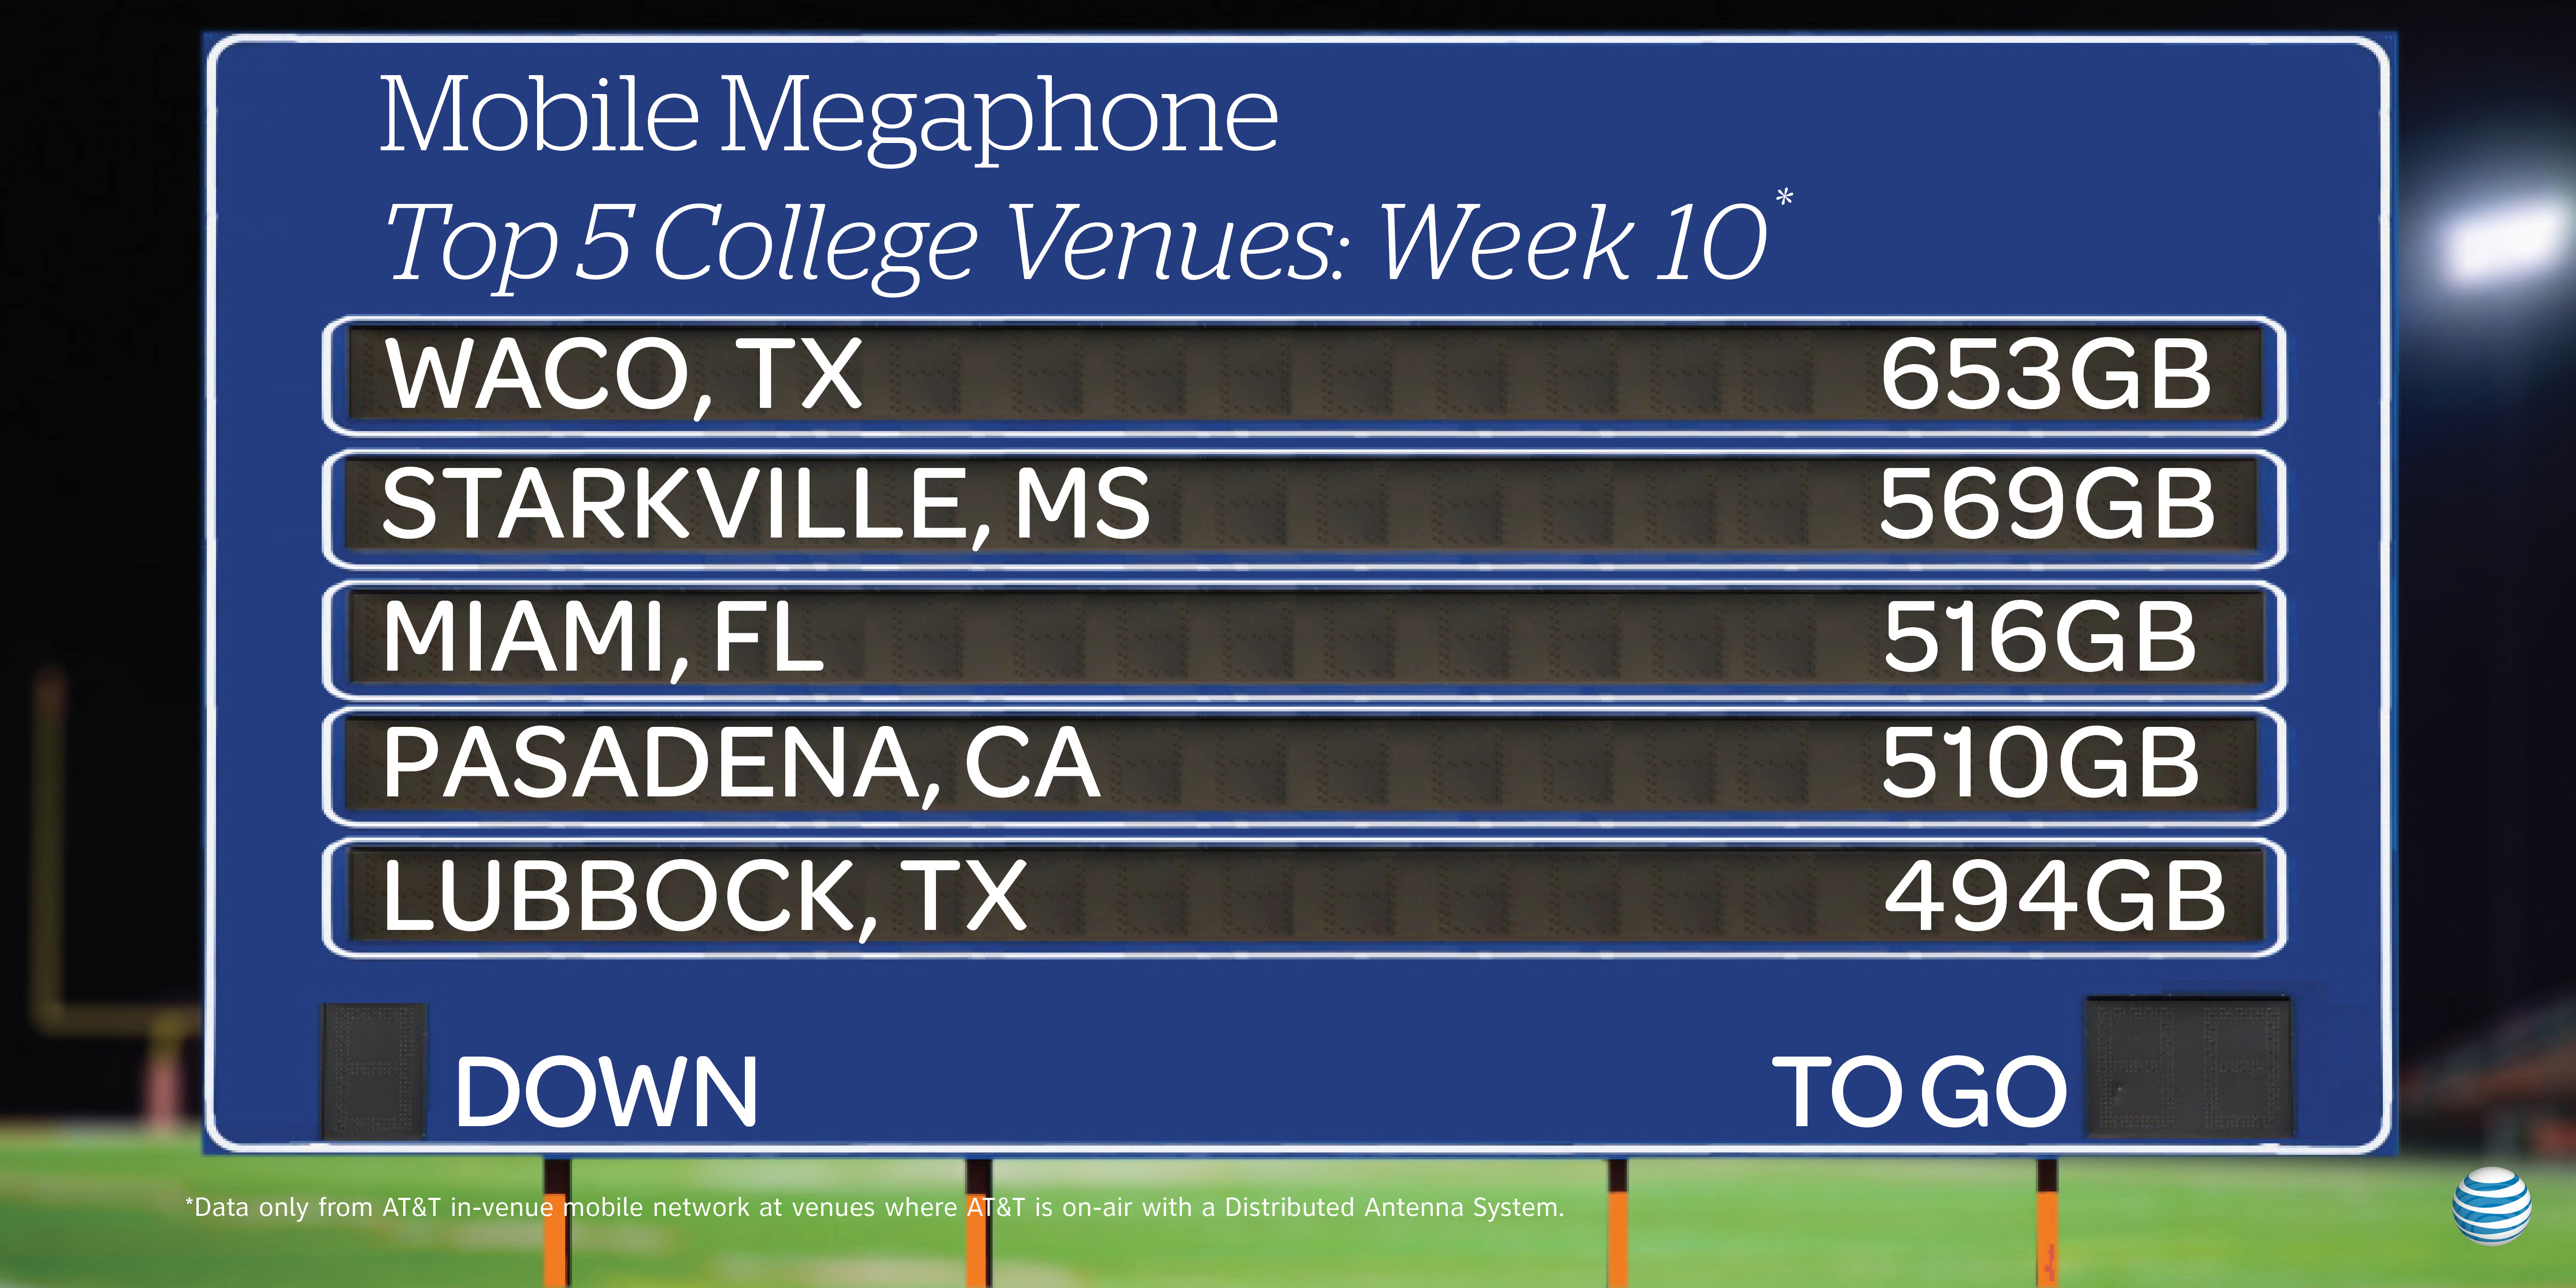
Top 5 Collegiate Venues by Total Mobile Data (11/6-11/8)
- Baton Rouge, LA – 699GB
- Equivalent to nearly 2 million social media post with photos
- Norman, OK – 630GB
- Equivalent to more than 1.8 million social media post with photos
- Starkville, MS – 436GB
- Equivalent to more than 1.2 million social media post with photos
- Auburn, AL – 423GB
- Equivalent to more than 1.2 million social media post with photos
- Austin, TX – 400GB
- Equivalent to more than 1.1 million social media post with photos
Two Opposing Ends of the Spectrum
- Our top five data-heavy venues from the past week of action for both college and pro football reinforced two opposing trends we’ve seen throughout the 2014 season. Both very close games and big time blowouts show more data usage than games somewhere in the middle.
- Out of the 10 venues above, no stadium hosted a game that was decided by a margin in the 8-16 point range.
- Half of the games were decided by the final possession.
- While 4 of the other 5 games were never within one score during the fourth quarter.
- Out of the 10 venues above, no stadium hosted a game that was decided by a margin in the 8-16 point range.
- This trend shows that people are reaching for their smartphones more in the most dramatic moments and when there isn’t much at stake.
Caveats:
- All figures include only data traffic seen on AT&T’s venue-specific mobile network.
- All data metrics come from only venues with a DAS where AT&T’s mobile network is on-air and under contract. These metrics are not comprehensive of every game played during this past weekend for professional or college football.
- This data is compiled from only football stadiums that had home games during this selected timeframe where AT&T is on-air on a DAS.