DALLAS, July 24, 2024 — AT&T Inc. (NYSE: T) reported second-quarter results that delivered durable and profitable 5G and fiber customer growth with increasing Mobility service and broadband revenues. Following consistent first-half performance, the Company reiterates all full-year 2024 financial guidance.
Second-Quarter Consolidated Results
- Revenues of $29.8 billion
- Diluted EPS of $0.49; adjusted EPS* of $0.57
- Operating income of $5.8 billion; adjusted operating income* of $6.3 billion
- Net income of $3.9 billion; adjusted EBITDA* of $11.3 billion
- Cash from operating activities of $9.1 billion, down $0.8 billion year over year
- Capital expenditures of $4.4 billion; capital investment* of $4.9 billion
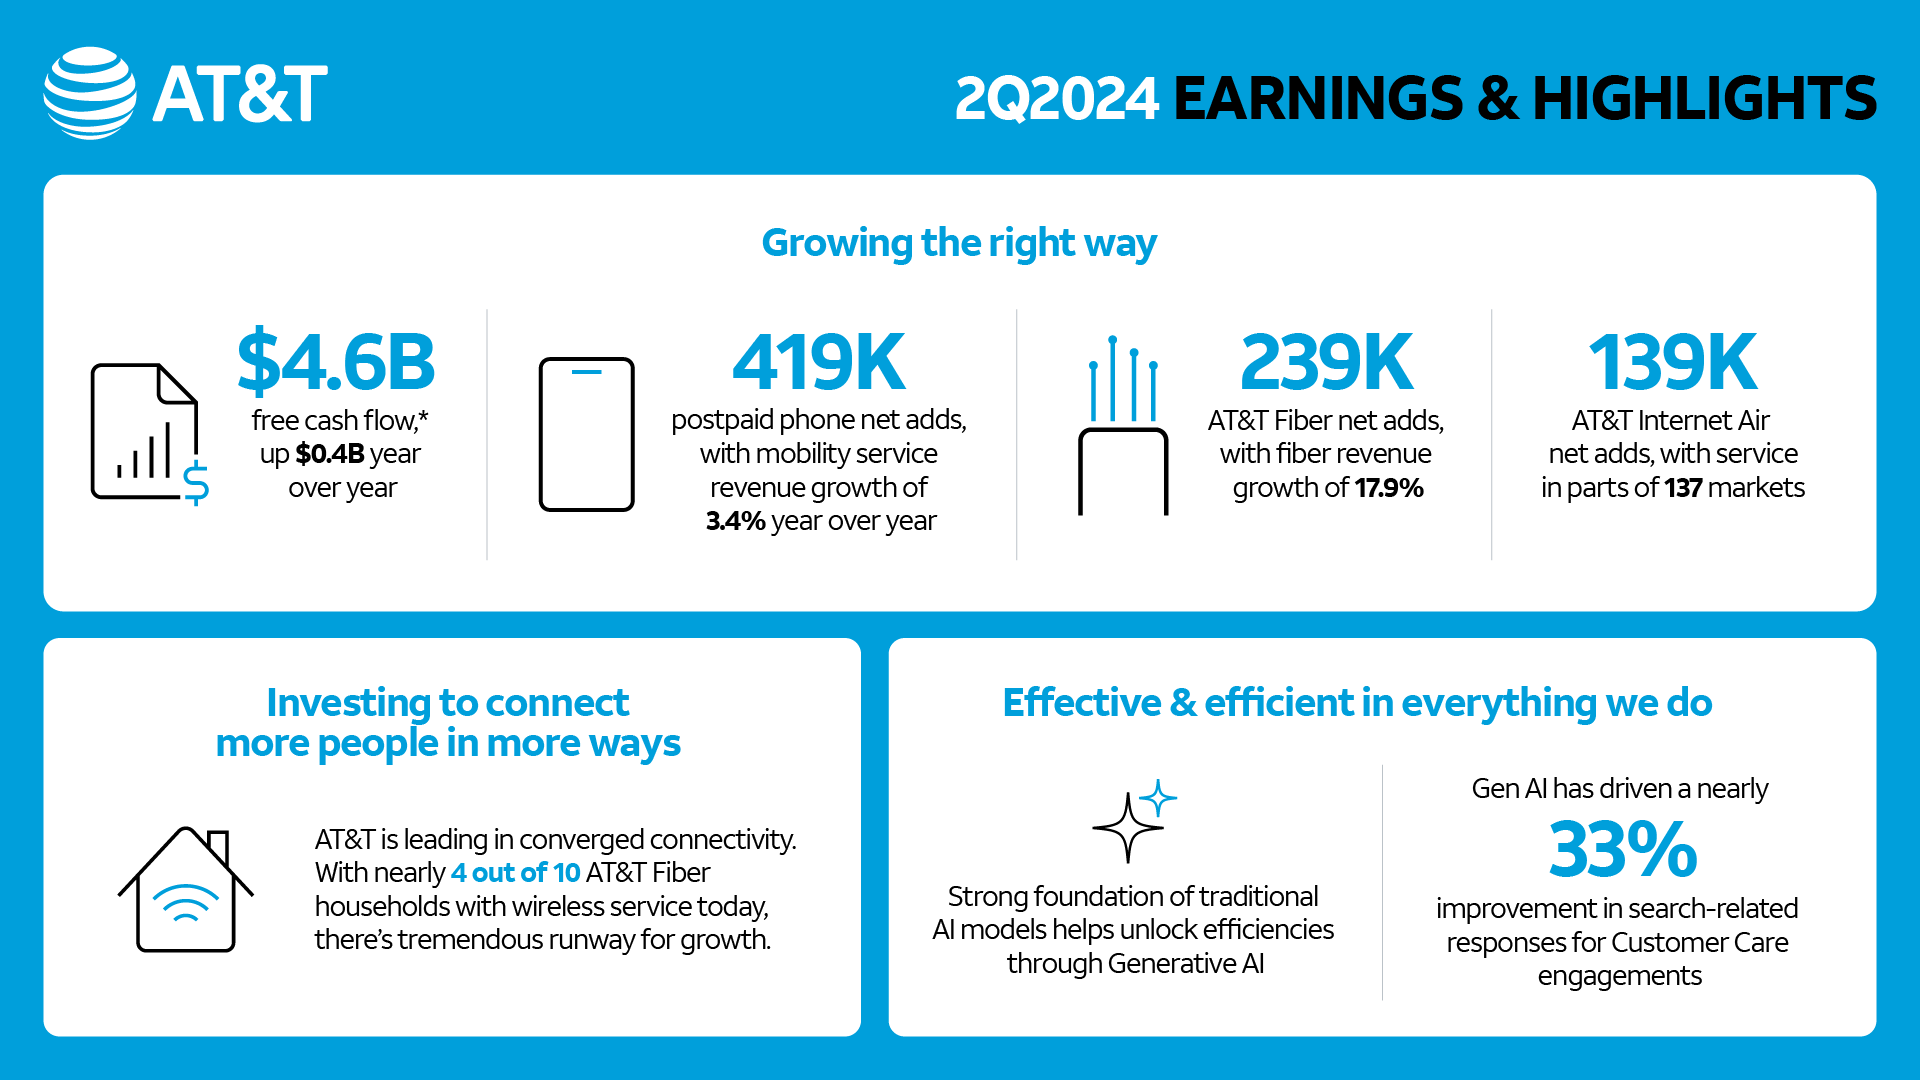
- Free cash flow* of $4.6 billion, up $0.4 billion year over year
Second-Quarter Highlights
- 419,000 postpaid phone net adds with an expected industry-leading postpaid phone churn of 0.70%
- Mobility service revenues of $16.3 billion, up 3.4% year over year
- 239,000 AT&T Fiber net adds; 200,000+ net adds for 18 consecutive quarters
- Consumer broadband revenues of $2.7 billion, up 7.0% year over year
- 27.8 million consumer and business locations passed with fiber
“For the past four years, we’ve delivered consistent, positive results that have repositioned AT&T. Our solid performance this quarter demonstrates the durable benefits of our investment-led strategy,” said John Stankey, AT&T CEO. “AT&T is leading the way in converged connectivity as customers increasingly seek one provider who can seamlessly connect them in their home, at work and on the go. This is proving to be a winning strategy. Today, nearly four of every 10 AT&T Fiber households also choose AT&T wireless service. As the nation’s largest consumer fiber builder, we see this as an opportunity to continue to grow subscribers and revenues, while deepening customer relationships.”
2024 Outlook
For the full year, AT&T reiterates guidance of:
- Wireless service revenue growth in the 3% range.
- Broadband revenue growth of 7%+.
- Adjusted EBITDA* growth in the 3% range.
- Capital investment* in the $21-$22 billion range.
- Free cash flow* in the $17-$18 billion range.
- Adjusted EPS* in the $2.15-$2.25 range.
- In 2025, the company expects to deliver Adjusted EPS* growth.
- The company continues to expect to achieve net debt-to-adjusted EBITDA* in the 2.5x range in the first half of 2025.
- On track to pass 30 million-plus consumer and business locations with fiber by the end of 2025.
Note: AT&T’s second-quarter earnings conference call will be webcast at 8:30 a.m. ET on Wednesday, July 24, 2024. The webcast and related materials, including financial highlights, will be available at https://investors.att.com.
AT&T 2Q2024 Earnings & Highlights
Consolidated Financial Results
- Revenues for the second quarter totaled $29.8 billion versus $29.9 billion in the year-ago quarter, down 0.4%. This was due to lower Business Wireline service revenues and declines in Mobility equipment revenues driven by lower sales volumes. These decreases were mostly offset by higher Mobility service, Consumer Wireline and Mexico revenues.
- Operating expenses were $24.0 billion versus $23.5 billion in the year-ago quarter. Operating expenses increased primarily due to our Open RAN network modernization efforts, including restructuring costs and accelerated depreciation on wireless network equipment, and higher depreciation related to our continued fiber and 5G investment. This was largely offset by lower Mobility equipment costs from lower sales volumes and benefits from continued transformation.
- Operating income was $5.8 billion versus $6.4 billion in the year-ago quarter. When adjusting for certain items, adjusted operating income* was $6.3 billion, versus $6.4 billion in the year-ago quarter.
- Equity in net income of affiliates was $0.3 billion, primarily from the DIRECTV investment. With adjustment for our proportionate share of intangible amortization, adjusted equity in net income from the DIRECTV investment* was $0.6 billion.
- Net income was $3.9 billion versus $4.8 billion in the year-ago quarter.
- Net income attributable to common stock was $3.5 billion versus $4.4 billion in the year-ago quarter. Earnings per diluted common share was $0.49 versus $0.61 in the year-ago quarter. Adjusting for $0.08, which includes restructuring costs, our proportionate share of intangible amortization from the DIRECTV equity method investment, and other items, adjusted earnings per diluted common share* was $0.57 compared to $0.63 in the year-ago quarter.
- Adjusted EBITDA* was $11.3 billion versus $11.1 billion in the year-ago quarter.
- Cash from operating activities was $9.1 billion, down $0.8 billion year over year, due to timing of working capital, including lower receivable sales partly offset by lower device payments.
- Capital expenditures were $4.4 billion in the quarter versus $4.3 billion in the year-ago quarter.
- Capital investment* totaled $4.9 billion versus $5.9 billion in the year-ago quarter. In the quarter, cash payments for vendor financing totaled $0.6 billion versus $1.6 billion in the year-ago quarter.
- Free cash flow* was $4.6 billion for the quarter versus $4.2 billion in the year-ago quarter.
- Total debt was $130.6 billion at the end of the second quarter, and net debt* was $126.9 billion. In the quarter, the company repaid $2.2 billion of long-term debt.
Segment and Business Unit Results
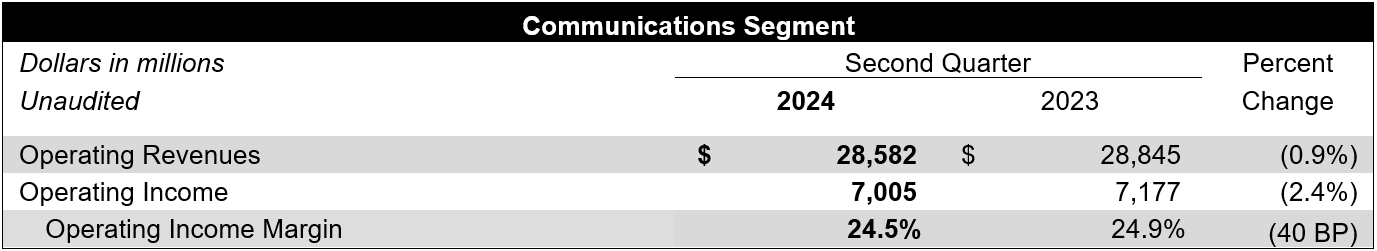
Communications segment revenues were $28.6 billion, down 0.9% year over year, with operating income down 2.4%.
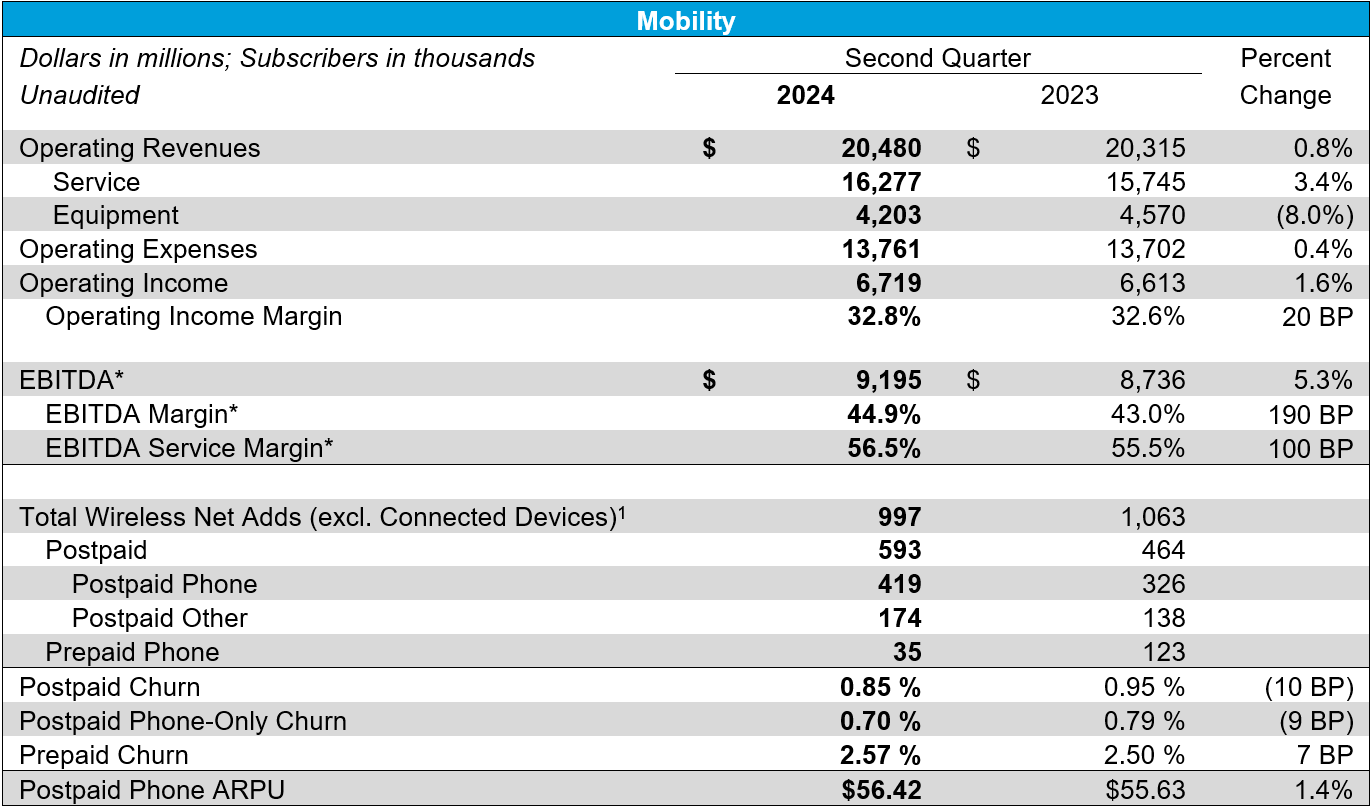
Mobility service revenue grew 3.4% year over year driving EBITDA service margin* expansion of 100 basis points. Postpaid phone net adds were 419,000 with postpaid phone churn of 0.70%, down 9 basis points year over year.
Mobility revenues were up 0.8% year over year, driven by service revenue growth of 3.4% from subscriber gains and postpaid phone average revenue per subscriber (ARPU) growth, offset by lower equipment revenues due to lower sales volumes. Operating expenses were up 0.4% year over year due to higher depreciation expense from Open RAN deployment and network transformation, partially offset by lower equipment expenses resulting from lower sales volumes. Operating income was $6.7 billion, up 1.6% year over year. EBITDA* was $9.2 billion, up $459 million year over year, driven by service revenue growth. This was the company’s highest-ever second-quarter Mobility EBITDA*.
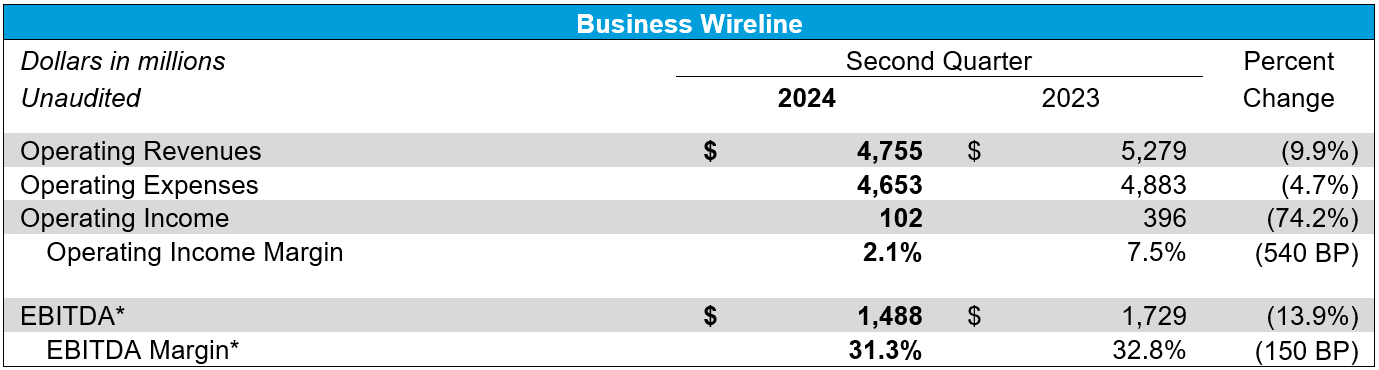
Business Wireline revenues and profitability declined year over year driven by continued secular pressures on legacy voice and data services that were partially offset by growth in fiber and other advanced connectivity services.
Business Wireline revenues were down 9.9% year over year, primarily due to lower demand for legacy voice and data services as well as product simplification, partially offset by growth in connectivity services. Results also reflect the second-quarter 2024 contribution of our cybersecurity business into a new joint venture. Operating expenses were down 4.7% year over year due to lower personnel, network access and customer support expenses, partially offset by higher vendor credits in the prior year quarter. Operating income was $102 million versus $396 million in the prior-year quarter, and EBITDA* was $1.5 billion, down $241 million year over year.
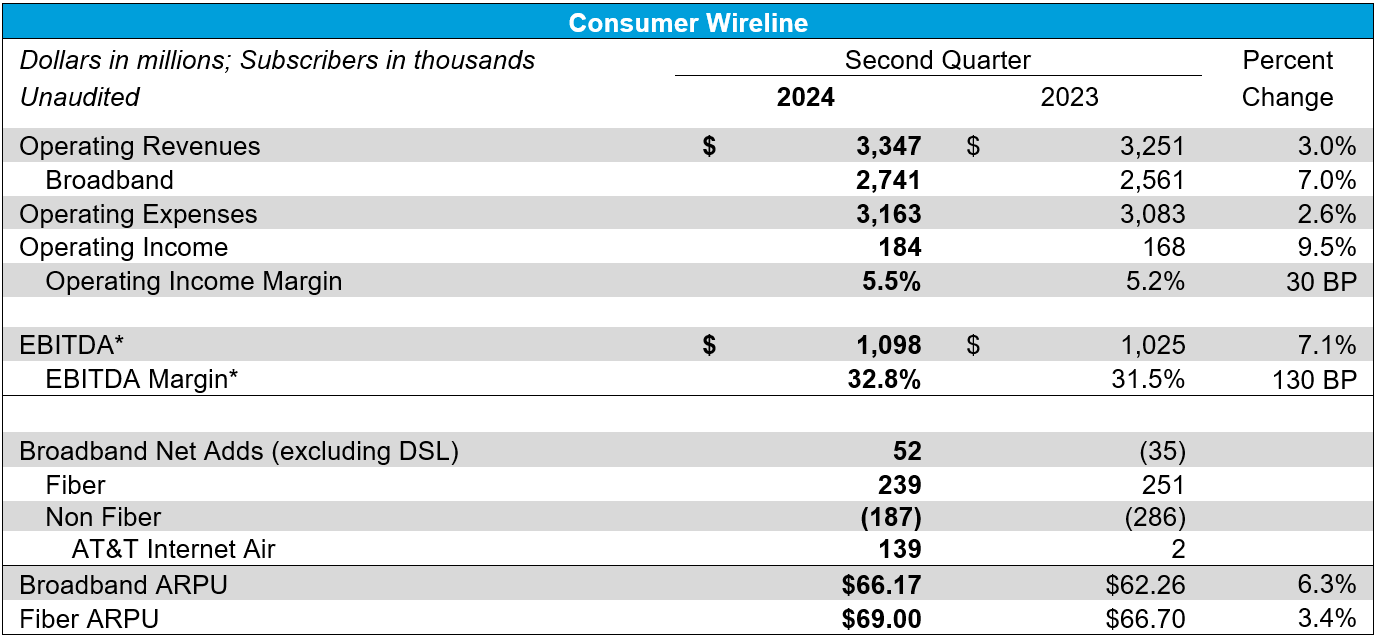
Consumer Wireline achieved strong revenue growth with improving EBITDA margins*. Consumer Wireline also delivered positive broadband net adds for the fourth consecutive quarter, driven by 239,000 AT&T Fiber net adds and 139,000 AT&T Internet Air net adds.
Consumer Wireline revenues were up 3.0% year over year driven by growth in broadband revenues attributable to fiber revenues, which grew 17.9%, partially offset by declines in legacy voice and data services and other services. Operating expenses were up 2.6% year over year, primarily due to higher depreciation and increased network-related costs, which were largely offset by lower customer support costs. Operating income was $184 million versus $168 million in the prior-year quarter, and EBITDA* was $1.1 billion, up $73 million year over year.
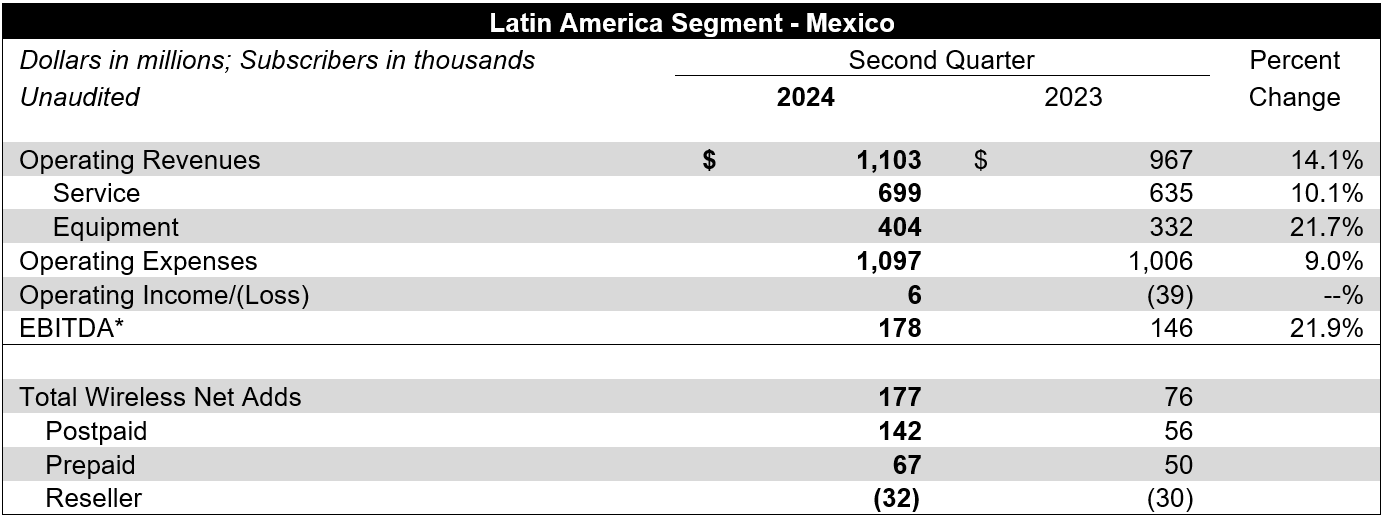
Latin America segment revenues were up 14.1% year over year, primarily due to higher equipment sales, subscriber growth, and favorable impacts of foreign exchange rates. Operating expenses were up 9.0% due to higher equipment and selling costs attributable to subscriber growth and unfavorable impact of foreign exchange. Operating income was $6 million compared to ($39) million in the year-ago quarter. EBITDA* was $178 million, up $32 million year over year.
Read more Investor Relations news