
DALLAS, January 24, 2024 — AT&T Inc. (NYSE: T) delivered strong fourth-quarter and full-year results highlighted by profitable 5G and AT&T Fiber subscriber gains. As a result, the company posted strong operating income and cash from operations, and surpassed its full-year guidance for adjusted EBITDA*, mobility service and broadband revenue growth as well as its previously increased guidance for free cash flow*.
Solid fourth-quarter results and strong free cash flow close out a strong year
- Fourth quarter cash from operating activities of $11.4 billion, up $1.0 billion or 10.0% year over year; Full-year cash from operating activities of $38.3 billion, up $2.5 billion versus the prior year.
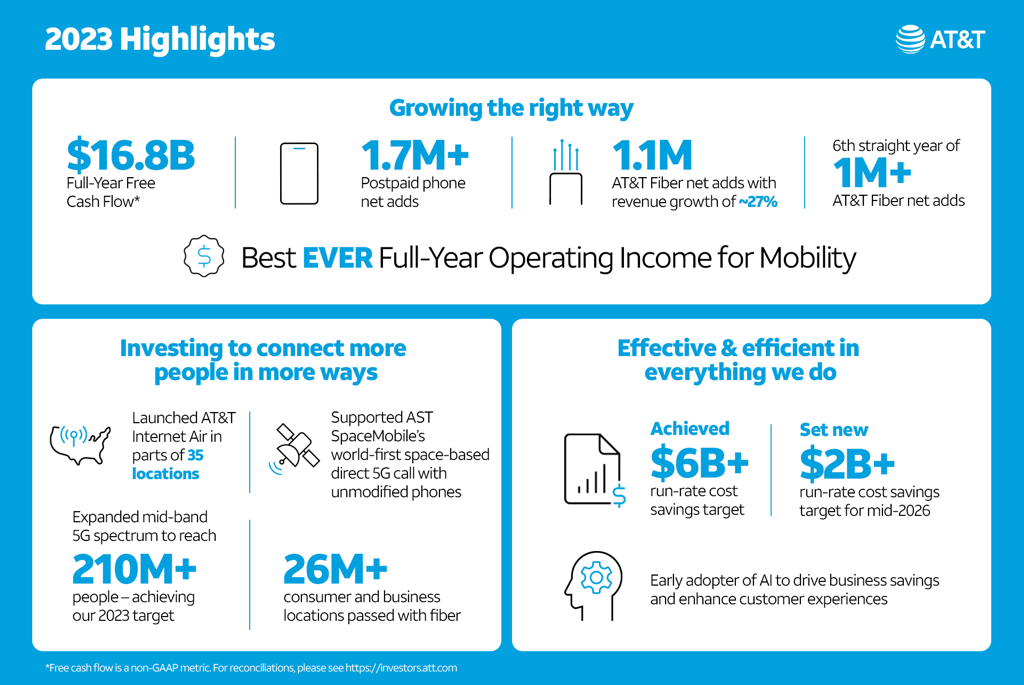
- Fourth quarter free cash flow* of $6.4 billion; Full-year free cash flow* of $16.8 billion, exceeded previously increased guidance, and up $2.6 billion versus the prior year.
- Fourth quarter revenues of $32.0 billion, up 2.2% year over year.
- Fourth quarter operating income of $5.3 billion, with adjusted operating income* of $5.8 billion; Full-year operating income of $23.5 billion, with adjusted operating income* of $24.7 billion, up 5.0% year over year.
“We accomplished exactly what we said we would in 2023, delivering sustainable growth and consistent business performance, resulting in full-year free cash flow of $16.8 billion, ahead of our raised guidance. As we advance our lead in converged connectivity, we will continue to scale our best-in-class 5G and fiber networks to meet customers’ growing demand for seamless, ubiquitous broadband, and drive durable growth for shareholders,” said John Stankey, AT&T CEO.
Strategy enables profitable 5G and fiber subscriber growth
- Full-year Mobility service revenues up 4.4%, above guidance; company’s best-ever full-year Mobility operating income.
- Full-year consumer broadband revenues up 8.1%, above guidance; driven by full-year AT&T Fiber revenue growth of 26.6%.
- 526,000 postpaid phone net adds in the fourth quarter; more than 1.7 million for the full-year 2023 with historically low churn levels and continued strong ARPU growth.
- 273,000 AT&T Fiber net adds in the fourth quarter; 1.1 million net adds for full-year 2023, 16 straight quarters with more than 200,000 net adds; sixth straight year with 1 million or more AT&T Fiber net adds.
Transformation helping to support margin growth
- Achieved $6 billion+ run-rate cost savings target in mid-year 2023; Strong early progress on achieving an incremental $2 billion+ run-rate cost savings target by mid-2026.
A leading investor in America’s broadband infrastructure
- Continued to enhance the largest wireless network in North America1 and expand the most reliable 5G network1; mid-band 5G spectrum now covers 210 million+ people, achieving end-of-year target.
- Grew the nation’s largest fiber network, which now passes 26 million+ consumer and business locations; on track to pass 30 million+ locations with fiber by the end of 2025.
2024 Outlook
For the full year, AT&T expects:
- Wireless service revenue growth in the 3% range.
- Broadband revenue growth of 7%+.
- Adjusted EBITDA* growth in the 3% range.
- Capital investment* in the $21-$22 billion range.
- Free cash flow* in the $17-$18 billion range.
- Adjusted EPS* of $2.15 to $2.25, which includes an expected ($0.17) higher depreciation expense, including accelerated depreciation from our open radio access network (Open RAN) transformation, ($0.07) lower other income due to declines in non-cash prior service credit amortization included in pension and postretirement benefits costs, ($0.05) lower capitalized interest and ($0.03) lower adjusted equity income from the DIRECTV investment*.
- In 2025, the company expects to deliver Adjusted EPS* growth.
Note: AT&T’s fourth-quarter earnings conference call will be webcast at 8:30 a.m. ET on Wednesday, January 24, 2024. The webcast and related materials, including financial highlights, will be available on AT&T’s Investor Relations website at https://investors.att.com.
Consolidated Financial Results
Revenues for the fourth quarter totaled $32.0 billion versus $31.3 billion in the year-ago quarter, up 2.2%. This increase primarily reflects higher Mobility, and to a lesser extent, Mexico and Consumer Wireline revenues, partly offset by continued declines in Business Wireline revenues.
Operating expenses were $26.8 billion versus $52.4 billion in the year-ago quarter. Operating expenses decreased primarily from non-cash goodwill impairment charges in the prior year quarter and benefits of continued transformation efforts, including lower personnel costs in 2023, partially offset by inflationary increases. The year-over-year decrease was partially offset by increased depreciation expense and higher equipment costs from the sale of higher-priced devices at Mobility and subscriber growth in Mexico.
Operating income (loss) was $5.3 billion versus ($21.1) billion in the year-ago quarter. When adjusting for certain items, adjusted operating income* from continuing operations was $5.8 billion versus $5.7 billion in the year-ago quarter.
Equity in net income of affiliates was $0.3 billion, primarily from the DIRECTV investment. With adjustment for our proportionate share of intangible amortization, adjusted equity in net income from the DIRECTV investment* was $0.6 billion.
Income (loss) from continuing operations was $2.6 billion versus ($23.1) billion in the year-ago quarter. Earnings per common share from continuing operations was $0.30 versus ($3.20) in the year-ago quarter. Adjusting for $0.24, which includes an actuarial loss on benefit plans, restructuring and impairments, our proportionate share of intangible amortization from the DIRECTV equity method investment and other items, adjusted earnings per diluted common share from continuing operations* was $0.54 compared to $0.61 in the year-ago quarter.
Cash from operating activities from continuing operations was $11.4 billion, up $1.0 billion year over year, reflecting operational growth, lower mobile device payments, and lower voluntary benefit plan contributions, partly offset by higher cash tax payments.
Capital expenditures were $4.6 billion in the quarter. Capital investment*, which includes $1.0 billion of cash payments for vendor financing, totaled $5.6 billion. Free cash flow* was $6.4 billion for the quarter.
Full-Year Results
Revenues for the full year totaled $122.4 billion versus $120.7 billion in 2022, up 1.4%, primarily driven by higher revenues from Mobility, and to a lesser extent, Mexico and Consumer Wireline revenues, partially offset by lower Business Wireline revenues. Revenue increases also reflect favorable impacts of foreign exchange rates in Mexico.
Operating expenses were $99.0 billion compared with $125.3 billion in 2022 primarily due to non-cash goodwill impairment charges in the prior year, benefits of continued transformation efforts, including lower personnel costs in 2023, partially offset by inflationary cost increases. To a lesser extent, the year-over-year decrease reflects lower equipment costs at Mobility, driven by lower device sales and associated selling costs in 2023 and 3G network shutdown costs in the first quarter of 2022, higher returns on benefit-related assets and lower customer support costs. Partially offsetting these decreases were higher depreciation expense, increased amortization of deferred customer acquisition costs and unfavorable impact of foreign exchange.
Operating income (loss) was $23.5 billion versus ($4.6) billion in 2022. When adjusting for certain items, adjusted operating income* from continuing operations was $24.7 billion versus $23.5 billion a year ago.
Equity in net income of affiliates was $1.7 billion, primarily from the DIRECTV investment. With adjustment for our proportionate share of intangible amortization, adjusted equity in net income from the DIRECTV investment* for full-year 2023 was $2.9 billion.
Income (loss) from continuing operations was $15.6 billion versus ($6.9) billion a year ago. Earnings per common share from continuing operations was $1.97 versus ($1.10) for full-year 2022. With adjustments for both years, adjusted earnings per diluted common share from continuing operations* was $2.41 versus $2.57 for full-year 2022.
Cash from operating activities from continuing operations was $38.3 billion, up from $35.8 billion in the prior year, due to operational growth, timing of working capital, including lower device payments partially offset by lower receivable sales, and higher cash income tax payments.
Capital expenditures were $17.9 billion for the full year. Capital investment*, which includes $5.7 billion of cash payments for vendor financing, totaled $23.6 billion. Free cash flow* was $16.8 billion for the full year.
Total debt was $137.3 billion at the end of the fourth quarter, and net debt* was $128.9 billion. The company expects to achieve net debt-to-adjusted EBITDA* in the 2.5x range in the first half of 2025.
Communications Operational Highlights
Fourth-quarter revenues were $30.8 billion, up 1.4% year over year due to increases in Mobility and Consumer Wireline, which more than offset a decline in Business Wireline. Operating income was $6.6 billion, up 0.5% year over year, with operating income margin of 21.5%, compared to 21.7% in the year-ago quarter.
Mobility
- Revenues were up 4.1% year over year to $22.4 billion due to both higher service and equipment revenues. Service revenues were $16.0 billion, up 3.9% year over year, primarily driven by subscriber and postpaid ARPU growth. Equipment revenues were $6.4 billion, up 4.7% year over year, driven by sales of higher-priced phones.
- Operating expenses were $16.2 billion, up 3.4% year over year, primarily due to higher network costs, increased amortization of customer acquisition costs, higher equipment costs driven by sales of higher-priced devices, and higher depreciation expense.
- Operating income was $6.2 billion, up 6.2% year over year. Operating income margin was 27.7%, compared to 27.2% in the year-ago quarter.
- EBITDA* was $8.4 billion, up 5.6% year over year with EBITDA margin* of 37.4%, up from 36.9% a year ago. EBITDA service margin* was 52.2%, up from 51.4% in the year-ago quarter.
- Total wireless net adds were 5.9 million including:
- 759,000 postpaid net adds with:
- 526,000 postpaid phone net adds
- (48,000) postpaid tablet and other branded computing device net losses
- 281,000 other net adds
- (132,000) prepaid phone net losses
- 759,000 postpaid net adds with:
- Postpaid churn was 1.01%, consistent with the year-ago quarter.
- Postpaid phone churn was 0.84%, consistent with the year-ago quarter.
- Prepaid churn was 2.97%, with Cricket substantially lower, versus 2.87% in the year-ago quarter.
- Postpaid phone-only ARPU was $56.23, up 1.4% versus the year-ago quarter, due to a mix shift to higher-priced unlimited plans and pricing actions.
- FirstNet® connections reached more than 5.5 million across approximately 27,500 agencies. FirstNet is the nationwide communications platform dedicated to public safety. The AT&T and FirstNet networks cover more than 99% of the U.S. population, and FirstNet covers more first responders than any other network in America.
Business Wireline
- Revenues were $5.1 billion, down 10.3% year over year due to lower demand for legacy voice and data services and product simplification, partly offset by growth in connectivity services.
- Operating expenses were $4.9 billion, down 4.1% year over year due to lower personnel costs associated with ongoing transformation initiatives and lower wholesale network access costs.
- Operating income was $165 million, down 69.4%, with operating income margin of 3.3% compared to 9.6% in the year-ago quarter. Operating income for the prior year quarter included impacts of about $100 million, primarily discrete intellectual property transaction revenues that did not repeat in 2023.
- EBITDA* was $1.5 billion, down 19.3% year over year, and was impacted by the items described above. EBITDA margin* was 30.4%, compared to 33.7% in the year-ago quarter.
Consumer Wireline
- Revenues were $3.4 billion, up 3.8% year over year due to gains in broadband more than offsetting declines in legacy voice and data and other services. Broadband revenues increased 8.3% due to fiber growth of 21.9%, partly offset by non-fiber revenue declines of 8.4%.
- Operating expenses were $3.1 billion, up 2.7% year over year due to increased depreciation expense, higher network-related and selling costs, partly offset by lower customer support costs.
- Operating income was $229 million, up 21.8% year over year with operating income margin of 6.8%, compared to 5.8% in the year-ago quarter.
- EBITDA* was $1.1 billion, up 10.2% year over year with EBITDA margin* of 33.1%, up from 31.2% in the year-ago quarter.
- Total broadband gains, excluding DSL, were 19,000, reflecting AT&T Fiber net adds of 273,000 and AT&T Internet Air net adds of 67,000, more than offsetting other non-fiber losses.
Latin America – Mexico Operational Highlights
Revenues were $1.1 billion, up 26.6% year over year primarily due to growth in both service and equipment revenues. Service revenues were $671 million, up 15.9% year over year, driven by favorable foreign exchange and subscriber growth. Equipment revenues were $419 million, up 48.6% year over year due to higher sales from subscriber growth and favorable foreign exchange rates.
Operating loss was ($43) million compared to ($79) million in the year-ago quarter. EBITDA* was $137 million compared to $85 million in the year-ago quarter, reflecting improved operations and the net favorable impact of foreign exchange.
Total wireless net adds were 562,000, including 450,000 prepaid net adds, 151,000 postpaid net adds and (39,000) reseller net losses.
Read more Investor Relations news
