AT&T Inc. (NYSE: T) reported strong fourth-quarter and full-year results that met, or exceeded, all 2025 consolidated financial guidance as it delivered its best year for consumer broadband subscriber growth in a decade. More customers are increasingly choosing AT&T as their one trusted provider for all of their connectivity needs – driving the fastest annual increase in its convergence rate with 42%2 of AT&T Fiber households also choosing AT&T for wireless. In 2025, in areas where AT&T offers converged services, it ranked #1 across customer satisfaction scores with consumers and small businesses in both wireless and internet connectivity.1 This solid momentum demonstrates the sustained success of the Company's investment-led, customer-centric strategy.
“We achieved or surpassed all of our consolidated full-year guidance for 2025,” said John Stankey, AT&T Chairman and CEO. “With new investments in spectrum and fiber, we’re set to win more customers in more categories and geographies across the U.S. Backed by the best assets in the industry, we are accelerating our strategy to deliver improved growth, the best customer experience and enhanced returns for shareholders over the next three years.”
Fourth-Quarter Consolidated Results
- Revenues of $33.5 billion
- Diluted EPS of $0.53, versus $0.56 in the year-ago quarter; adjusted EPS* of $0.52, versus $0.43 in the year-ago quarter
- Operating income of $5.8 billion; adjusted operating income* of $6.1 billion
- Net income of $4.2 billion; adjusted EBITDA* of $11.2 billion
- Cash from operating activities of $11.3 billion, versus $11.9 billion in the year-ago quarter
- Capital expenditures of $6.8 billion; capital investment* of $7.1 billion
- Free cash flow* of $4.2 billion, versus $4.0 billion in the year-ago quarter
Fourth-Quarter Highlights
- 421,000 postpaid phone net adds with postpaid phone churn of 0.98%
- Mobility service revenues of $17.0 billion, up 2.4% year over year
- 283,000 AT&T Fiber net adds and 221,000 AT&T Internet Air net adds, representing more than half a million combined advanced home internet net additions for the second consecutive quarter
- Consumer Wireline fiber revenues of $2.2 billion, up 13.6% year over year
Full-Year Consolidated Results
- Revenues of $125.6 billion
- Diluted EPS of $3.04, versus $1.49 a year ago; adjusted EPS* of $2.12 versus $1.95 a year ago
- Operating income of $24.2 billion; adjusted operating income* of $25.5 billion
- Net income of $23.4 billion; adjusted EBITDA* of $46.4 billion
- Cash from operating activities of $40.3 billion, versus $38.8 billion a year ago
- Capital expenditures of $20.8 billion; capital investment* of $22.0 billion
- Free cash flow* of $16.6 billion, versus $15.3 billion in 2024
Full-Year Highlights
- More than 1.5 million postpaid phone net adds for fifth straight year
- Mobility service revenues of $67.4 billion, up 3.1% year over year
- More than 1 million AT&T Fiber net adds for eighth consecutive year, and 875,000 AT&T Internet Air net adds
- Consumer Wireline fiber revenues of $8.6 billion, up 17.0% year over year
- Repurchased approximately $4.3 billion in common shares under the 2024 authorization
- 32.0 million consumer and business locations passed with fiber
New Segment Reporting
Beginning with the Company's first-quarter 2026 results, AT&T plans to revise its operating segments to reflect the evolution of its business model to focus on delivering converged advanced connectivity services across 5G and fiber to consumer and business customers. Accordingly, the Company's planned new reportable segments are:
- Advanced Connectivity, which represents results primarily from the Company’s domestic 5G and fiber based wireless, internet and other advanced connectivity services, on a recast basis contributed approximately 90% of consolidated revenues in 2025. Results for this segment will be provided in aggregate with supplemental disclosures for performance of the Company’s consumer and business relationships.
- Legacy, which represents results from the Company’s domestic legacy voice and data services provided over its copper-based network to consumer and business customers. These results include revenues derived from copper-based services and direct operating costs.
- Latin America, which will continue to represent results for the Company’s wireless business in Mexico.
To assist investors and analysts with this planned transition to the new segment reporting structure, the Company has provided a recast of its historical quarterly and annual results for 2023 through 2025 for these segments in its Form 8-K dated January 28, 2026, and additional information is available at investors.att.com.
Long-Term Outlook
As a result of the Company’s investments in 5G and fiber, including its previously announced acquisitions that are expected to close in early 2026 of substantially all of Lumen’s Mass Markets fiber business and wireless spectrum licenses from EchoStar, AT&T expects to achieve improved growth in adjusted EBITDA* and adjusted EPS* and higher free cash flow* through 2028. The Company’s long-term outlook for 2026-2028 includes:
- Service revenue growth in the low-single-digit range annually.
- Adjusted EBITDA* growth in the 3% to 4% range in 2026, improving to 5% or better in 2028 as growth in Advanced Connectivity increasingly more than offsets declines in Legacy.
- Adjusted EPS* of $2.25 to $2.35 in 2026 with a double-digit 3-year CAGR through 2028.
- The Company's outlook for adjusted EPS* anticipates that its acquisitions mentioned above will be modestly dilutive to adjusted EPS* in 2026-2027 and accretive beginning in 2028.
- Capital investment* in the $23 billion to $24 billion range annually during 2026-2028.
- Free cash flow* of $18 billion+ in 2026, $19 billion+ in 2027, and $21 billion+ in 2028.
- The Company's free cash flow* outlook anticipates annual cash taxes of $1.0 billion to $1.5 billion and cash contributions to its employee pension plan of approximately $350 million in 2026, with no significant additional cash contributions expected until 2030.
- The Company's outlook for cash taxes reflects further assessment of its expected savings due to tax provisions in the One Big Beautiful Bill Act, as compared to the outlook it provided in its second-quarter 2025 earnings release. Management expects to use incremental tax savings to fund working capital and growth initiatives.
The Company's consolidated financial outlook anticipates strong and sustained growth in Advanced Connectivity segment financial performance during 2026-2028, including:
- Advanced Connectivity service revenue growth in the mid-single-digit range annually, including expected growth of 5%+ in 2026, which includes approximately 100 basis points of growth from the planned acquisition of retail fiber subscribers from Lumen.
- Advanced Connectivity EBITDA* growth in the mid-to-high-single-digit range annually, including expected growth of 6%+ in 2026. The Company does not expect its planned acquisition of retail fiber subscribers from Lumen to materially impact EBITDA* in 2026.
The Company’s consolidated financial outlook assumes sustained declines in service revenues within its Legacy segment as it makes progress against its objective of powering-down its energy-intensive copper-based network across the large majority of its footprint by the end of 2029 and upgrading customers to advanced connectivity services powered by 5G and fiber. AT&T expects Legacy service revenue to decline 20%+ in 2026 and to be immaterial by the end of 2029 with negative EBITDA* from this segment expected after 2027 until it has substantially eliminated direct costs associated with operating its copper-based network.3
Upon closing of the Lumen transaction, AT&T will hold the acquired fiber network assets, including certain fiber network build capabilities, in a wholly owned subsidiary. The Company plans to sell partial ownership in this subsidiary to an equity partner that will co-invest in the ongoing business. Beginning with the closing of the Lumen transaction, AT&T expects to report this business as held-for-sale and discontinued operations, with the results of operations and direct cash flows excluded from the Company’s continuing operations. After closing the anticipated sale of partial ownership to an equity partner, AT&T’s share of the equity income (loss) of this subsidiary will be included in adjusted EPS* from continuing operations. The Company’s long-term outlook provided above is presented on a continuing operations basis and excludes discontinued operations.
Long-Term Capital Allocation Plan
AT&T expects to return $45 billion+ to shareholders during 2026-2028 through dividends and share repurchases. Under this capital return plan, the Company expects to maintain its current annualized common stock dividend of $1.11 per share. Management also expects to complete share repurchases under its current $10 billion authorization before the end of 2026 and to commence repurchases under a subsequent $10 billion authorization that has been approved by the Company’s Board of Directors. The Company expects to repurchase approximately $8 billion of common stock during 2026 under these authorizations and to maintain a consistent pace of share repurchases through 2028, pending additional Board authorization.
AT&T expects its net debt-to-adjusted EBITDA ratio* to increase to approximately 3.2x following its transactions with Lumen and EchoStar and to decline to approximately 3x by the end of 2026. AT&T continues to expect net leverage will return to a level consistent with its target in the 2.5x range within approximately three years following the closing of these acquisitions. The Company expects to maintain a consistent approach to capital returns while reducing net leverage to its target range.
Note: AT&T’s fourth-quarter and full-year 2025 earnings conference call will be webcast at 8:30 a.m. ET on Wednesday, January 28, 2026. The webcast and related materials, including financial highlights, will be available at investors.att.com.
Consolidated Financial Results
- Revenues for the fourth quarter totaled $33.5 billion, versus $32.3 billion in the year-ago quarter, up 3.6%. This was due to higher Mobility, Consumer Wireline, and Mexico revenues, partially offset by a decline in Business Wireline.
- Operating expenses were $27.7 billion, versus $27.0 billion in the year-ago quarter. Operating expenses increased primarily due to higher sales volumes in the Company’s Mobility business unit, which drove higher equipment, advertising, selling, and bad debt expenses. Also contributing to higher costs were higher restructuring charges that were offset by benefits of continued transformation initiatives and lower content licensing fees. Operating expense declines also included lower depreciation expense as certain legacy assets were fully depreciated, partially offset by continued fiber investment and network upgrades.
- Operating income was $5.8 billion, versus $5.3 billion in the year-ago quarter. When adjusting for certain items, adjusted operating income* was $6.1 billion, versus $5.4 billion in the year-ago quarter.
- Equity in net income (loss) of affiliates declined $1.1 billion versus the year-ago quarter, reflecting the completed sale of the DIRECTV investment in the third-quarter 2025.
- Net income was $4.2 billion, versus $4.4 billion in the year-ago quarter.
- Net income (loss) attributable to common stock was $3.8 billion, versus $4.0 billion in the year-ago quarter. Earnings per diluted common share was $0.53, versus $0.56 in the year-ago quarter. Adjusting for $(0.01) which removes a benefit from tax items, and excludes an actuarial loss on benefit plans, restructuring costs, and other items, adjusted earnings per diluted common share* was $0.52, versus $0.43 in the year-ago quarter.
- Adjusted EBITDA* was $11.2 billion, versus $10.8 billion in the year-ago quarter.
- Cash from operating activities was $11.3 billion, versus $11.9 billion in the year-ago quarter. Operational growth and lower cash tax payments in the quarter were more than offset by lower distributions from DIRECTV, a voluntary pension plan contribution of $750 million, and cash payments for apportioned legal settlements. The voluntary pension plan contribution included a pull-forward of $350 million that the Company previously planned to contribute in 2026, which was offset by lower than anticipated cash tax payments as a result of recent tax legislation.
- Capital expenditures were $6.8 billion, consistent with the year-ago quarter. Capital investment* totaled $7.1 billion, consistent with the year-ago quarter. Cash payments for vendor financing totaled $0.4 billion, versus $0.2 billion in the year-ago quarter.
- Free cash flow,* which excludes cash flows from DIRECTV, was $4.2 billion, versus $4.0 billion in the year-ago quarter.
Full-Year Financial Results
- Revenues for the full year totaled $125.6 billion, versus $122.3 billion in 2024, up 2.7%. This was due to higher Mobility, Consumer Wireline and Mexico revenues, partially offset by a decline in Business Wireline.
- Operating expenses for the full year were $101.5 billion, versus $103.3 billion in 2024. Operating expenses decreased primarily due to a $4.4 billion non-cash goodwill impairment in the prior year, lower costs from continued transformation initiatives, and lower content licensing fees. These decreases were partially offset by higher sales volumes in the Company’s Mobility business unit, which drove higher equipment, advertising, selling, and bad debt expenses. Also contributing to higher costs were apportioned legal settlements during 2025, higher restructuring charges, higher network-related expenses, higher advertising costs associated with a new campaign in 2025, and increased depreciation expense from continued fiber investment and network upgrades.
- Operating income for the full year was $24.2 billion, versus $19.0 billion in 2024. When adjusting for certain items, adjusted operating income* was $25.5 billion, versus $24.2 billion last year.
- Equity in net income of affiliates for the full year was $1.9 billion, versus $2.0 billion in 2024, reflecting cash distributions received by AT&T, prior to the sale of the DIRECTV investment, in excess of the carrying amount of the Company's investment.
- Net income for the full year was $23.4 billion, including a $5.6 billion gain on the sale of the DIRECTV investment, versus $12.3 billion in 2024, which included a $4.4 billion non-cash goodwill impairment.
- Net income attributable to common stock for the full year was $21.9 billion, versus $10.7 billion a year ago. Earnings per diluted common share was $3.04, versus $1.49 a year ago. Adjusting for $(0.92) which removes a gain on the sale of the DIRECTV investment and equity in net income of DIRECTV, and excludes other items, adjusted earnings per diluted common share* was $2.12, versus $1.95 last year.
- Adjusted EBITDA* for the full year was $46.4 billion, versus $44.8 billion a year ago.
- Cash from operating activities for the full year was $40.3 billion, versus $38.8 billion a year ago. Operational growth and lower cash tax payments for the year were partially offset by voluntary pension plan contributions of $1.15 billion, advanced cash payments for wholesale access which can be utilized on invoices over future periods, and cash payments for apportioned legal settlements.
- Capital expenditures for the full year were $20.8 billion, versus $20.3 billion a year ago. Capital investment* totaled $22.0 billion for the full year, relatively consistent with $22.1 billion a year ago. Cash payments for vendor financing totaled $1.2 billion, versus $1.8 billion in 2024.
- Free cash flow,* which excludes cash flows from DIRECTV, was $16.6 billion for the full year compared to $15.3 billion a year ago.
- Total debt was $136.1 billion at the end of the fourth-quarter 2025, and net debt* was $117.4 billion.
Segment and Business Unit Results
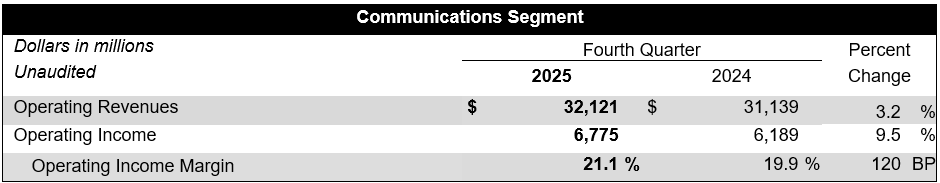
Communications segment revenues were $32.1 billion, up 3.2% year over year, with operating income of $6.8 billion, up 9.5% year over year.
Mobility service revenues grew 2.4% year over year, driving growth in operating income of 4.5% and EBITDA* of 3.1%. Operating income margin declined 20 basis points year over year, with EBITDA* service margin improving by 30 basis points year over year.
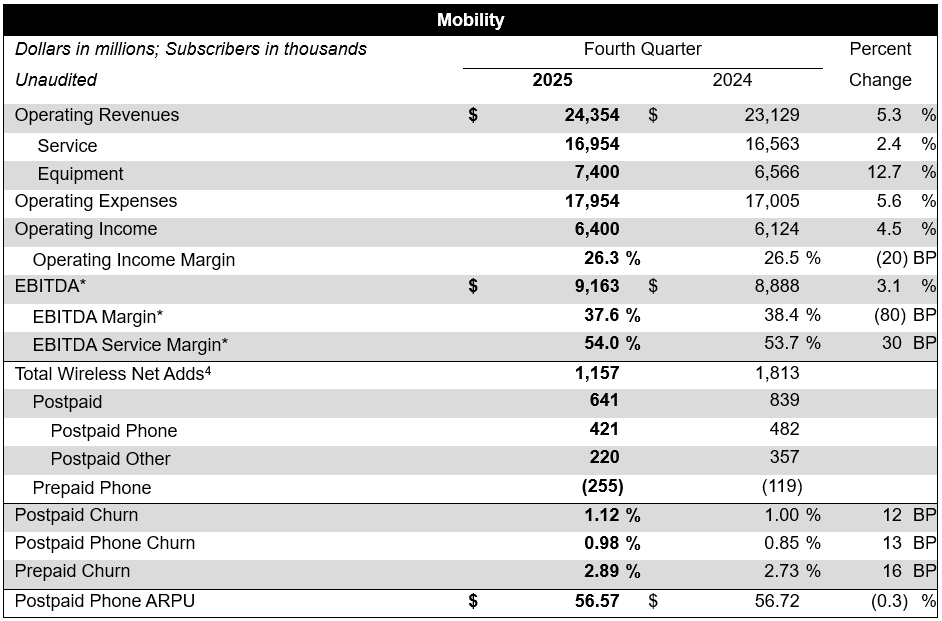
Mobility revenues were up 5.3% year over year, driven by service revenue growth of 2.4% and equipment revenue growth of 12.7% from higher wireless device sales volumes. Operating expenses were up 5.6% year over year, driven by higher sales volumes, which drove higher equipment, advertising, selling, and bad debt expenses. These increases were partially offset by lower content licensing fees and expense declines from transformation initiatives. Operating income was $6.4 billion, up 4.5% year over year. EBITDA* was $9.2 billion, up $275 million year over year.
Business Wireline revenues declined year over year, driven by continued secular pressures on legacy and other transitional services, which were partially offset by accelerated growth in fiber and advanced connectivity services.
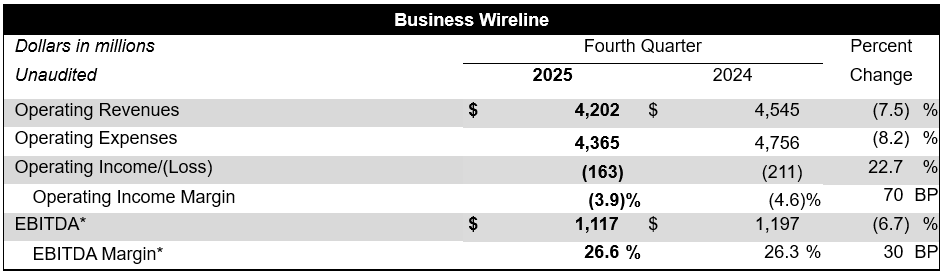
Business Wireline revenues were down 7.5% year over year due to continued declines in legacy and other transitional services of 17.5%, partially offset by 6.8% growth in fiber and advanced connectivity services. Operating expenses were down 8.2% year over year due to lower personnel costs and savings from transformation initiatives, and lower network costs. Depreciation expense was lower year over year as certain legacy assets were fully depreciated, partially offset by ongoing capital investment for strategic initiatives, such as fiber. Operating income was $(163) million, versus $(211) million in the year-ago quarter, and EBITDA* was $1.1 billion, down $80 million year over year.
Consumer Wireline delivered strong year-over-year broadband revenue growth, driven by a 13.6% increase in fiber revenue. Consumer Wireline also achieved positive broadband net adds for the tenth consecutive quarter, driven by 283,000 AT&T Fiber net adds and 221,000 AT&T Internet Air net adds.
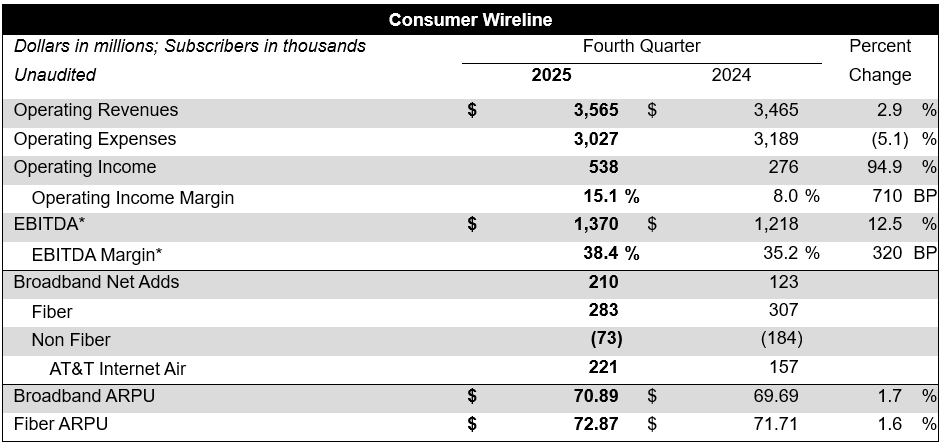
Consumer Wireline revenues were up 2.9% year over year, driven by broadband revenue growth of 6.7% due to fiber revenue growth of 13.6%, partially offset by declines in legacy voice and data services and other services. Operating expenses were down 5.1% year over year due to lower depreciation expense, as certain legacy assets were fully depreciated, partially offset by ongoing capital investment for strategic initiatives, such as fiber and network upgrades and expansion. Expenses also decreased from lower content licensing fees and customer support costs. These decreases were partially offset by higher network costs. Operating income was $538 million, versus $276 million in the year-ago quarter, and EBITDA* was $1.4 billion, up $152 million year over year.
Latin America profitability continues to improve with full-year growth in operating income of more than $100 million.
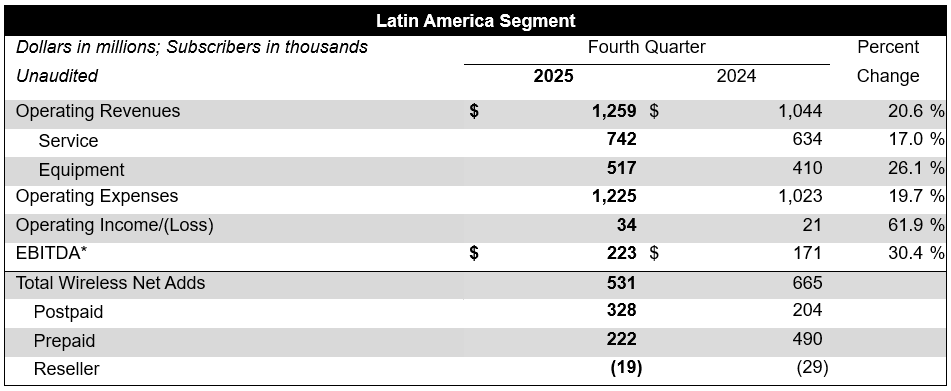
Latin America segment revenues were up 20.6% year over year, driven by increased equipment sales and growth in subscribers and ARPU, as well as the favorable impacts of foreign exchange. Operating expenses were up 19.7% due to the unfavorable impacts of foreign exchange rates, higher equipment and bad debt expense due to subscriber growth, and higher depreciation expense. Operating income was $34 million compared to $21 million in the year-ago quarter. EBITDA* was $223 million compared to $171 million in the year-ago quarter.
Read more Investor Relations news