Touchdown!
Pro football is now at the center of the sports universe with its “Big Game” just around the corner. If the postseason play we’ve seen so far is any primer, then the main event should be spectacular. Across the last three weeks, fans’ data usage habits have increased across the board at stadiums hosting playoff action. Below is a look at the data usage metrics and trends saw from the first three rounds of the pro football playoffs:

Pro Football’s Playoff Scoreboard at a Glance
- AT&T customers used 4460GB of data on stadium’s in-venue cellular network during the 10 playoff games played across eight venues.
o 4460GB is equivalent to 12.7M social media posts with photos
o That’s a 22% increase compared to the 8 venues’ 2014 regular season average
o Half of the venues that hosted playoff games recorded the highest data usage total of the 2014 season during their playoff game.
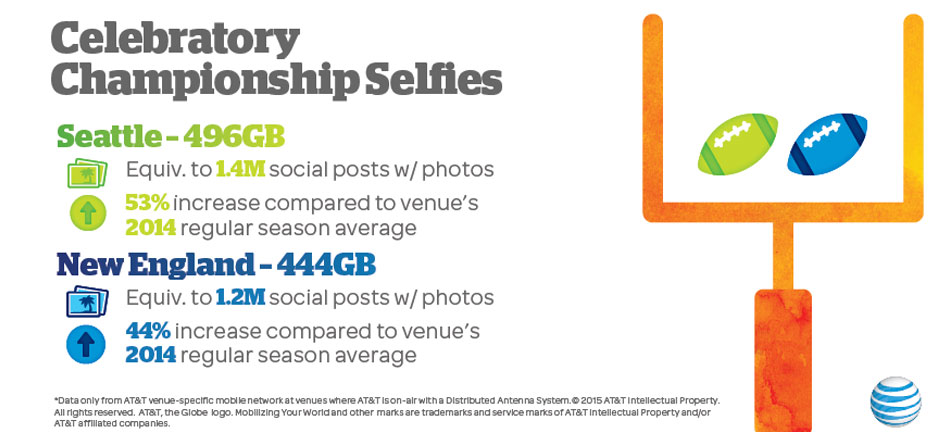
- The conference championship games in Seattle and New England resulted in the two greatest data traffic increases of the 10 playoff games compared to their regular season data traffic averages.
o In Seattle, 496GB were used by AT&T customers during the championship game
- 496GB is equivalent to 1.4M social media posts with photos
- That’s a 53% increase compared to the venue’s 2014 regular season average
o In New England, 444GB were used by AT&T customers during the championship game
- 444B is equivalent to 1.2M social media posts with photos
- That’s a 44% increase compared to the venue’s 2014 regular season average.
- The game with the most data traffic so far was the first round showdown in Dallas when 1150GB were used by AT&T customers.
o 1150GB is equivalent to 3.2M social media posts with photos
o That’s a 38% increase compared to the venue’s 2014 regular season average
Caveats:
- All figures include only data traffic seen on AT&T’s venue-specific mobile network.
- All data metrics come from only venues with a DAS where AT&T’s mobile network is on-air and under contract. These metrics are not comprehensive of every game played during the pro or college football season.
- This data is compiled from only football stadiums that had home games during this selected timeframe where AT&T is on-air on a DAS.